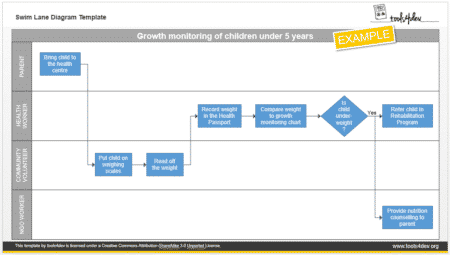
Swim lane diagrams (also called ‘Rummler-Brache Diagrams’ and ‘Cross-Functional Flowcharts’) are a great way to break-down a process and visualise its steps. You can use this method to explore inefficiencies in a process and make improvements. The diagrams are also useful for communicating a process in chart-form to other people who may not be as familiar.

Swim lane diagrams can be used to analyse different types of processes, from simple to complex. Examples include the ordering and delivery of drugs to health centres, auditing village water pumps, rolling out a stakeholder survey, delivering health and vitamin supplements to target villages, etc. A lot of procurement processes can specifically benefit from analysis with swim lane diagrams as they quite often involve multiple steps and a number of different people and groups.
Basically any process that involves multiple people and/or groups and multiple steps can benefit from being analysed with swim lane diagrams.
Choose a process that you want to look at
The first step to go through is to identify what process it is that you want to analyse. Processes that involve paper-based systems or technology systems, and procurement processes are particularly good ones to look at as they will quite often have areas where the process can be improved.
Decide what your objectives are for reviewing the process
It is quite likely that your primary objective for reviewing a process will be to ‘improve’ it in some way. You may be looking to reduce the overall time that a process takes to complete (e.g. faster processing of a new patient application form at a health clinic), reducing the errors within a process (e.g. reducing incorrect stock deliveries from head office to in-country offices) or introducing a completely new element to a process (e.g. adding accountability monitoring to drug deliveries to a district pharmacy).
It is important to be sure to know what your objectives are when looking at analysing your processes so that you are focusing on the right characteristics of the process.
Identify people, groups, stakeholders and systems
The next step is to identify the people (or job roles), groups, stakeholders and systems involved in a process. These will be the people that the process involves in some way or that are required to complete an action as part of the overall process.

List all the tasks, sub-processes and decisions involved in the process
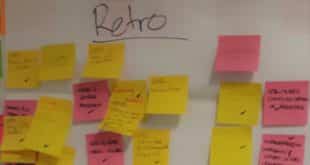
You now want to identify all of the steps in the process. A great way to start is with sticky notes on a wall or with pieces of paper on a desk. This way you can see the process and can make amendments easily without having to edit a document on a computer. You can also get other people easily involved.
You should constantly be asking “What else does this person/group have to do?” and “What happens next?” Don’t be afraid to come back to sections you’ve already looked at to review the actions and steps involved. You should also review the process with the groups and stakeholders that are involved so that they can verify the steps and add to your understanding of the process.
Using shapes to show action
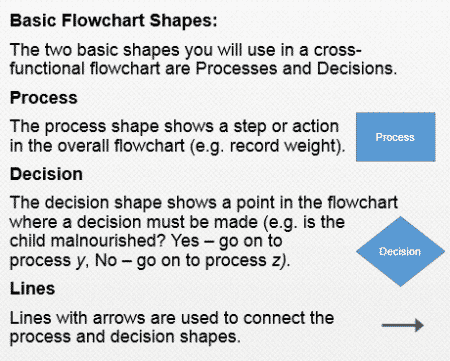
It is important to know that the shapes you use in your diagram have meaning. I tend to keep things simple and just use shapes for steps and decisions, and arrows to show the direction that the step in the process is travelling in.

Presenting your process
If you have a relatively simple process, you can use the tools4dev swim lane diagram template.
Checking your process
There are a number of things that you can look at when analysing your process. Check for:
- Actions that bounce between the same actors multiple times
- Bottlenecks where a process will stop because there are not enough resources in a particular ‘lane’ (e.g. not enough staff at the health clinic to deal with a specific activity in a timely manner)
- Gaps or missing steps that are not logical in the process
- Duplication of steps
- Activities that don’t add value / don’t need to happen / slow down the process dramatically
Photo By Ragesoss (Own work) [GFDL or CC-BY-3.0], via Wikimedia Commons


