

One of the most common questions I get asked by people doing surveys in international development is “how big should my sample size be?”. While there are many sample size calculators and statistical guides available, those who never did statistics at university (or have forgotten it all) may find them intimidating or difficult to use.
If this sounds like you, then keep reading. This guide will explain how to choose a sample size for a basic survey without any of the complicated formulas. For more easy rules of thumb regarding sample sizes for other situations, I highly recommend Sample size: A rough guide by Ronán Conroy and The Survey Research Handbook by Pamela Alreck and Robert Settle.
This article is a short introduction to the topic for a more in-depth coverage of the topic consider enrolling in the free online course offered by University of Florida.
This advice is for:
- Basic surveys such as feedback forms, needs assessments, opinion surveys, etc. conducted as part of a program.
- Surveys that use random sampling.
This advice is NOT for:
- Research studies conducted by universities, research firms, etc.
- Complex or very large surveys, such as national household surveys.
- Surveys to compare between an intervention and control group or before and after a program (for this situation Sample size: A rough guide).
- Surveys that use non-random sampling, or a special type of sampling such as cluster or stratified sampling (for these situations see Sample size: A rough guide and the UN guidelines on household surveys).
- Surveys where you plan to use fancy statistics to analyse the results, such as multivariate analysis (if you know how to do such fancy statistics then you should already know how to choose a sample size).
The minimum sample size is 100
Most statisticians agree that the minimum sample size to get any kind of meaningful result is 100. If your population is less than 100 then you really need to survey all of them.
A good maximum sample size is usually 10% as long as it does not exceed 1000
A good maximum sample size is usually around 10% of the population, as long as this does not exceed 1000. For example, in a population of 5000, 10% would be 500. In a population of 200,000, 10% would be 20,000. This exceeds 1000, so in this case the maximum would be 1000.
Even in a population of 200,000, sampling 1000 people will normally give a fairly accurate result. Sampling more than 1000 people won’t add much to the accuracy given the extra time and money it would cost.
Choose a number between the minimum and maximum depending on the situation
Suppose that you want to survey students at a school which has 6000 pupils enrolled. The minimum sample would be 100. This would give you a rough, but still useful, idea about their opinions. The maximum sample would be 600, which would give you a fairly accurate idea about their opinions.
Choose a number closer to the minimum if:
- You have limited time and money.
- You only need a rough estimate of the results.
- You don’t plan to divide the sample into different groups during the analysis, or you only plan to use a few large subgroups (e.g. males / females).
- You think most people will give similar answers.
- The decisions that will be made based on the results do not have significant consequences.
Choose a number closer to the maximum if:
- You have the time and money to do it.
- It is very important to get accurate results.
- You plan to divide the sample into many different groups during the analysis (e.g. different age groups, socio-economic levels, etc).
- You think people are likely to give very different answers.
- The decisions that will be made based on the results of the survey are important, expensive or have serious consequences.
In practice most people normally want the results to be as accurate as possible, so the limiting factor is usually time and money. In the example above, if you had the time and money to survey all 600 students then that will give you a fairly accurate result. If you don’t have enough time or money then just choose the largest number that you can manage, as long as it’s more than 100.
If you would like to learn more about Survey Data Collection consider taking the free course offered by University of Michigan and University of Maryland. Enroll here.
If you want to be a bit more scientific then use this table
While the previous rules of thumb are perfectly acceptable for most basic surveys, sometimes you need to sound more “scientific” in order to be taken seriously. In that case you can use the following table. Simply choose the column that most closely matches your population size. Then choose the row that matches the level of error you’re willing to accept in the results.
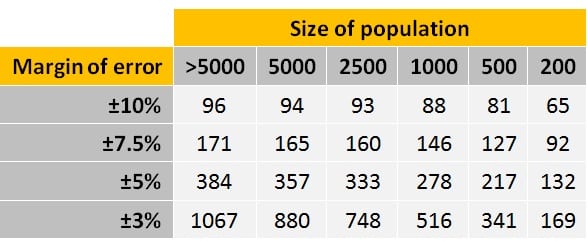
You will see on this table that the smallest samples are still around 100, and the biggest sample (for a population of more than 5000) is still around 1000. The same general principles apply as before – if you plan to divide the results into lots of sub-groups, or the decisions to be made are very important, you should pick a bigger sample.
Note: This table can only be used for basic surveys to measure what proportion of the population have a particular characteristic (e.g. what proportion of farmers are using fertiliser, what proportion of women believe myths about family planning, etc). It can’t be used if you are trying to compare two groups (e.g. control versus intervention) or two points in time (e.g. baseline and endline surveys). See Sample size: A rough guide for other tables that can be used in these cases.
Relax and stop worrying about the formulas
It’s a dirty little secret among statisticians that sample size formulas often require you to have information in advance that you don’t normally have. For example, you typically need to know (in numerical terms) how much the answers in the survey are likely to vary between individuals (if you knew that in advance then you wouldn’t be doing a survey!).
So even though it’s theoretically possible to calculate a sample size using a formula, in many cases experts still end up relying rules of thumb plus a good deal of common sense and pragmatism. That means you shouldn’t worry too much if you can’t use fancy maths to choose your sample size – you’re in good company.
Once you’ve chosen a sample size, don’t forget to write good survey questions, design the survey form properly and pre-test and pilot your questionnaire.
Photo by James Cridland