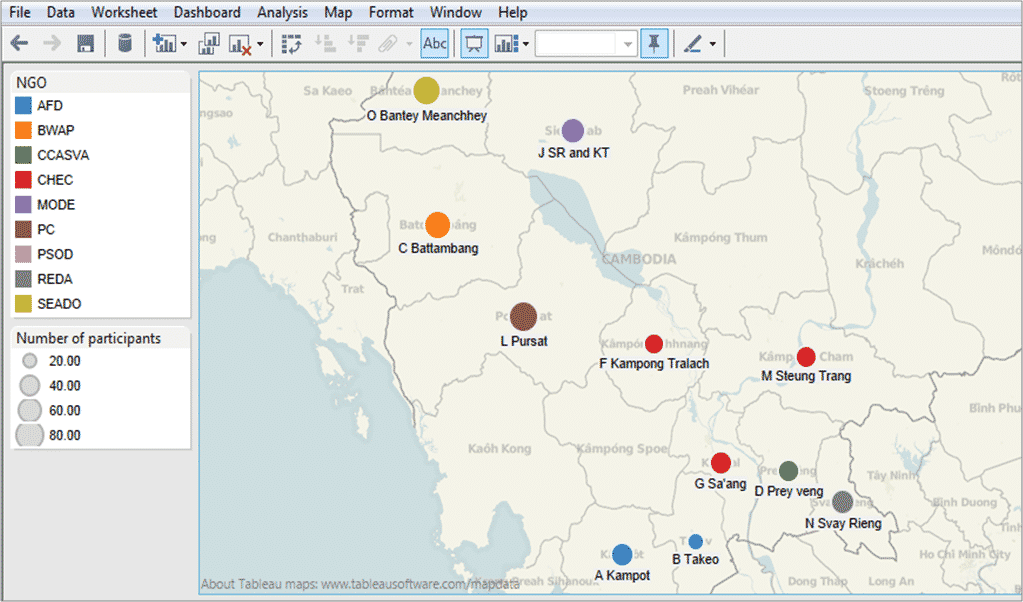
Making a map of your project has many benefits. It can help people in other countries (like donors) understand exactly where your project is located. It can help you make better decisions on logistics, and you can use it display the project results for different target areas.
These days, making a map of your project doesn’t need to be difficult. You don’t need any fancy equipment – all you need is a smart phone, a computer and an internet connection. Just follow these steps to make a simple map of your own project.
Get a smart phone and install a GPS app
You don’t need a GPS device to do GPS. Almost any good quality smart phone will do. Find a smart phone and install a free GPS app on it. The best (and easiest) GPS app I’ve found for my Android phone is GPS-Simple for Android, and you can also check this list of apps for Apple iOS devices.
To use GPS-Simple, you may need to change some of the settings on your phone, such as enabling GPS.
Go to each location and write down the latitude and longitude from the app
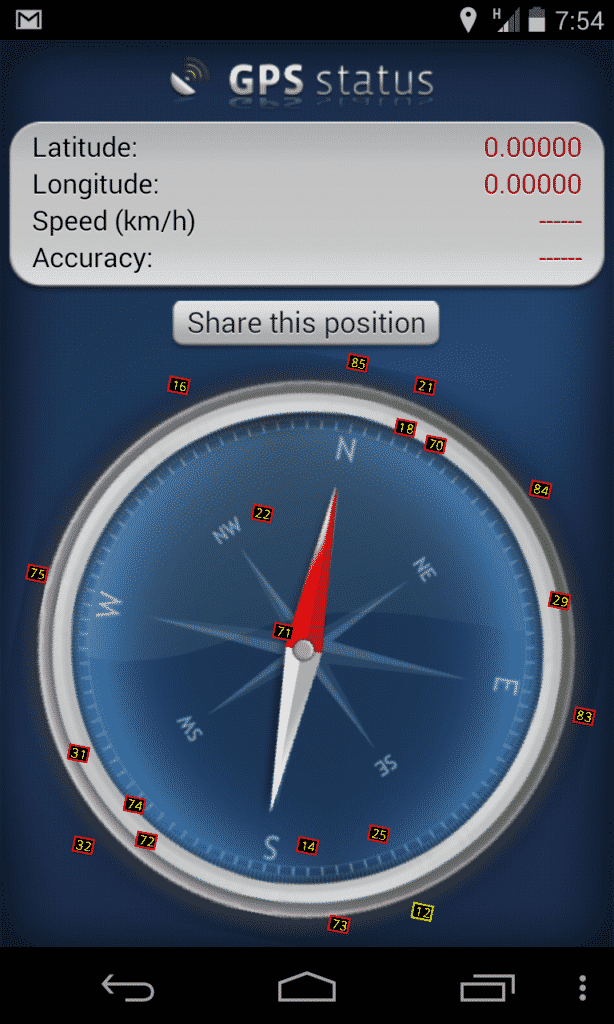
Once you’ve got your phone you should go to each location you want to map and use the GPS app to get the latitude and longitude. If the location is very remote you might need to move around a bit until your phone can get a lock on it. The GPS-Simple app will even tell you how accurate the result is (for me it is normally 10-20 meters, but it varies).
A GPS app interface
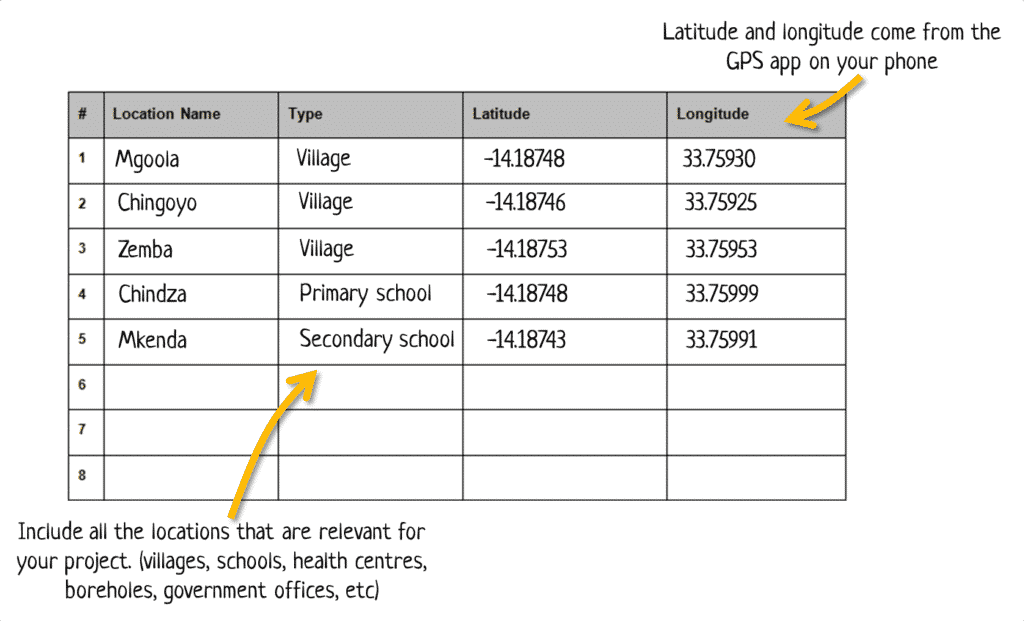
Once you’ve got the latitude and longitude write them down on a record sheet, along with the name of the location and what it is (village, health centre, school, borehole, etc). An example of a record sheet is shown below:
If you want to do this all on your phone (without having to write on a record sheet) then check out Device Magic. Device Magic allows you to create data collection forms for your mobile phone that include GPS locations.
Enter the data into a spreadsheet
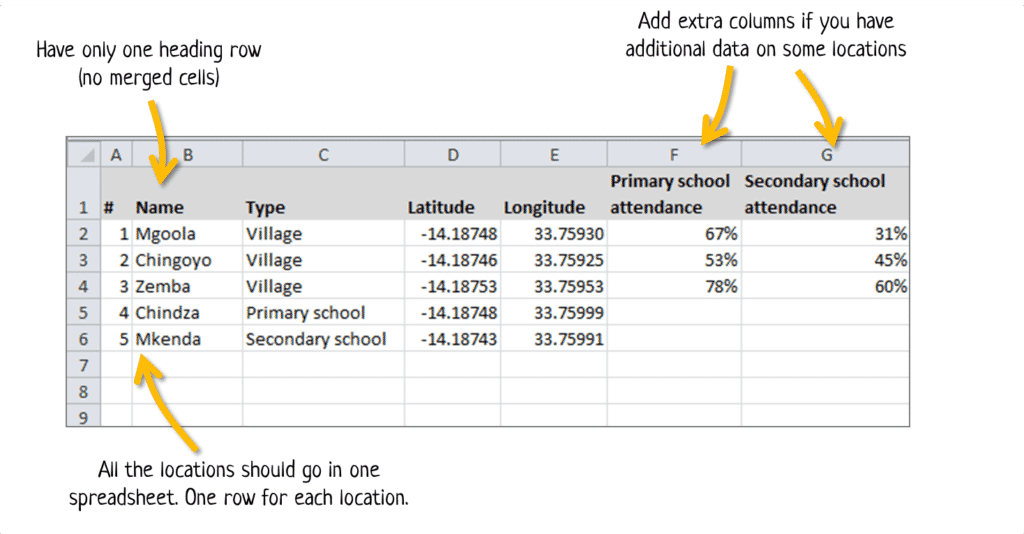
If you decided to write down everything on a paper form then you’ll need to enter that data into a spreadsheet. The spreadsheet should have one heading row, with each row after that being used for only one location.
At this point you can also add extra information on each location. For example, if you are mapping villages for a school program you could add the percentage of children attending school in each village. If you are mapping boreholes you could add whether the borehole is functioning or not. When you make your map, this information can be shown using the colour or size of the dots.
Upload the data onto a map
There are several different mapping providers that will allow you to upload your data onto their publicly available maps, including Google Earth and Bing Maps.
They all work in a similar way, but personally my favourite is Tableau Public because it allows you to combine charts and maps together. To make a map on Tableau Public you first have to download and install the software on your computer. Then open the data from the spread sheet in Tableau Public.
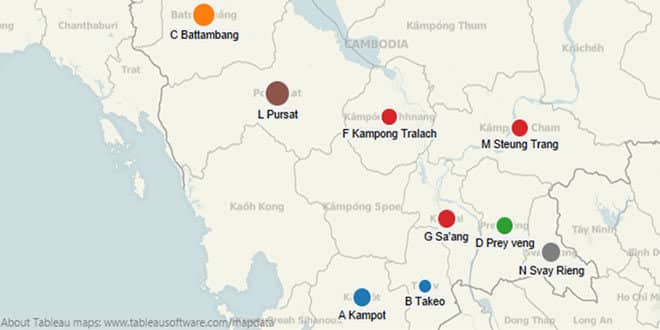
Once the data is open you just drag and drop things onto the map. Have a look at this step-by-step guide from Tableau Public to see how it’s done. Here is an example of a simple map I created:
I recently created another map for a new project I’m working on. Getting the GPS coordinates for around 100 villages took 3 days, entering it into a spreadsheet took 1 day and making the map (playing around with all the settings and colouring) took 1 day. So all up, less than a week of work for a very useful result.

