Review Overview
Functionality - 4
Ease of Use - 6
Value for Money - 10
6.7
TOCO is a free application that allows you to create a Theory of Change diagram.
A Theory of Change describes how and why you think change happens. In simple terms, it’s like completing the sentence “if we do X then Y will change because…”.
This is particularly important in international development because people often have underlying assumptions or beliefs about change that may not be accurate. For example people often assume that increased knowledge will lead to a change in behaviour, although this is rarely the case (see this post on Theories of Change for more information on how they differ from logical frameworks).
A Theory of Change is normally shown as a flow chart or diagram with accompanying text. The Theory of Change Online (TOCO) software was created by ActKnowledge as an “accessible, easy-to-use learning tool for creating and implementing a Theory of Change”.
How does it work?
TOCO is an online application that allows you to create a Theory of Change diagram. The software is free and accessed directly through the website, so you don’t need to download and install it (but you do need an internet connection).
Once in the application, you can create boxes that represent the elements of your theory (e.g. outcomes, outputs, prerequisites, etc.) and place them on the page. Each box has associated indicators and the boxes can be linked with arrows. For each arrow you can specify a rationale (why does this box lead to that box?) and interventions (what will you do to make this box lead to that box?). You can also group boxes together under headings, add comments, text, and assumptions.
What is it like to use in practice?
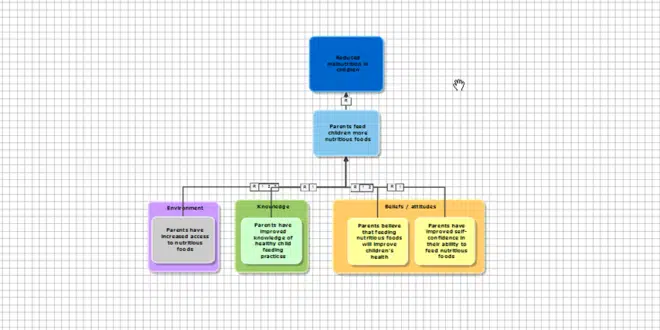
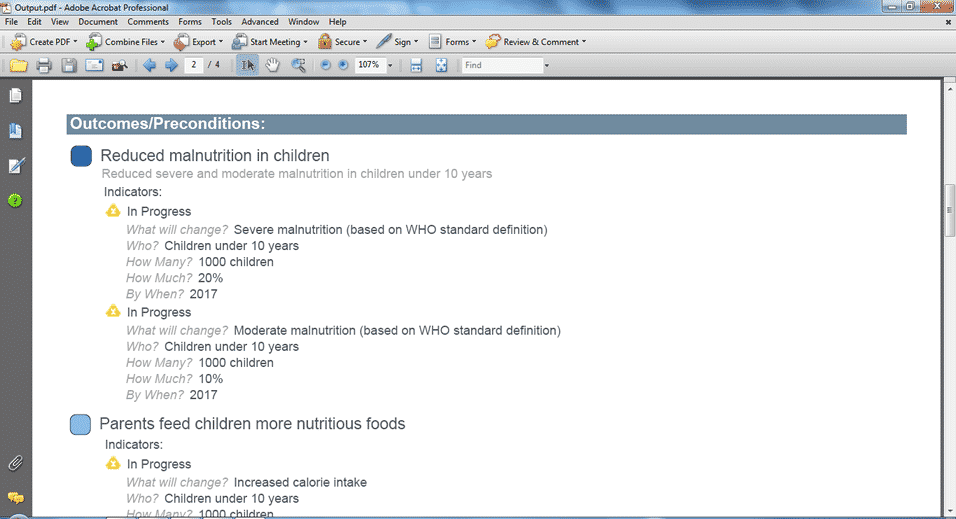
I tested the TOCO software by creating a simple Theory of Change diagram for a child malnutrition program. Signing up to use the software and creating a new Theory of Change file was easy. The first step was to create a long term outcome for the theory along with indicators to measure the outcome. For each indicator TOCO allows you to specify what will change, who, how many, how much and by when it will change (see below).
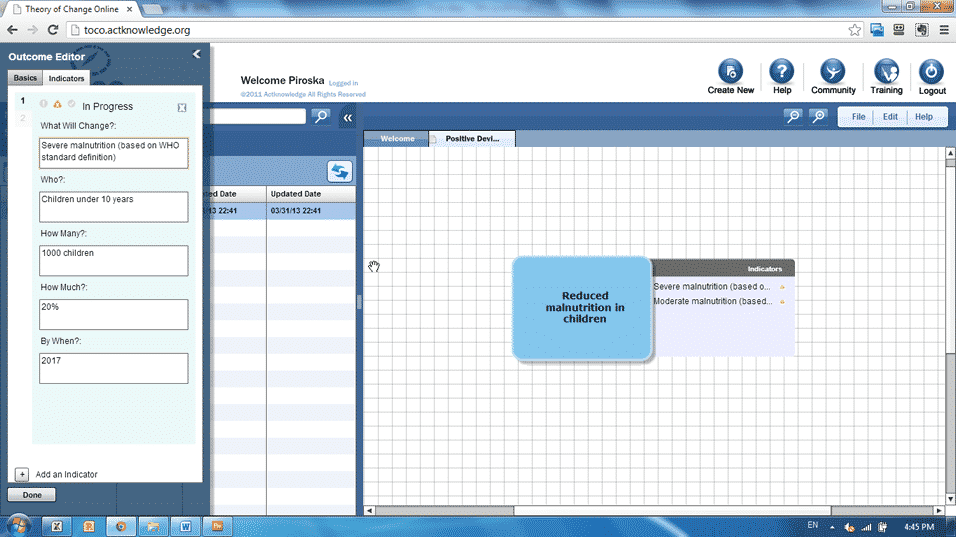
After creating the long term outcome things became a little more tricky. The user interface was not completely intuitive so I had to consult the help guide for advice on how to add more items to the page. Eventually I was able to add additional boxes and arrows. For each arrow I added a rationale and some interventions (see below).
Once my diagram was finished I used the “print to PDF” function to save everything in one document. The digram in the PDF looked the same as the online version, but was followed by pages of text describing the indicators, rationales, interventions and assumptions that I had added (see below).
Overall the result looked almost identical to the Theory of Change diagrams I normally create using regular office software, such as Microsoft Visio, PowerPoint and Word. It was just a bit more organised because there were already fields available for the items I needed to include.
What are the limitations?
Although TOCO software can help you create a Theory of Change diagram, it won’t create the Theory of Change for you. You still need to decide what items to place in the diagram, how they relate to each other and what the underlying assumptions are. This takes careful critical thinking, and lots of practice.
Because of this, TOCO is a useful aid for someone who has previous experience creating Theories of Change, but it doesn’t help someone who is creating their first theory. The website does include one guided example for “newbies” but it would be better if the software included a “Theory of Change Wizard” that could walk you through the process step-by-step, giving examples along the way. At least then you could be sure you had gone through the processes thoroughly.
Another limitation of TOCO is that you can only use boxes and and arrows in the diagram. A recent DFID review recommends being more creative and flexible with Theory of Change diagrams, allowing for things such as cycles and feedback loops which are often present in the real world. This makes representing complicated Theories of Change difficult using TOCO.
The bottom line
TOCO, and similar products such as DoView, can help keep your Theory of Change diagram neat and tidy. However, using regular office software to create diagrams is just as easy, and more flexible.
TOCO is useful when:
- You already know how to create a Theory of Change.
- You want to keep your Theory of Change diagram neat and tidy.
- You don’t want to create flow charts and diagrams using regular office software.
- Your Theory of Change is simple and can be represented with only squares and arrows.
- The donor has not specified what your Theory of Change needs to look like.
- You have an internet connection.
TOCO is NOT useful when:
- You don’t know what a Theory of Change is, or how to decide which boxes and arrows should go where.
- You are happy to create flow charts and diagrams using regular office software.
- Your Theory of Change is complex and can’t be represented with only squares and arrows.
- The donor has specified what your Theory of Change needs to look like (in which case use their template).
- You don’t have an internet connection.