

Download logframe template and example
Love them or hate them, logical frameworks (logframes) have become a staple of international development programs. Most donors will require one as part of your proposal, and it’s the first things an evaluator will ask for.
Our logframe template is one of the most popular downloads on tools4dev. This article provides more detailed steps on exactly how to use the template.
There is no agreed standard for logframes. Some organisations call the goal an outcome, while others call it an objective or an impact. For a comparison of terminology between different organisations check out the “Rosetta Stone” of logical frameworks.
Need more help with logical frameworks?
The purpose of a logframe
A logframe is a table that lists your program activities, short term outputs, medium term outcomes, and long term goal. It is supposed to show the logic of how the activities will lead to the outputs, which in turn lead to the outcomes, and ultimately the goal.
A logframe is different to a theory of change. For more information on the differences see our blog post “Theory of Change vs Logical Framework – what’s the difference?”
Should I start with the goal or the activities?
Many people wonder whether they should start filling the logframe from the top (starting with the goal), or from the bottom (starting with the activities).
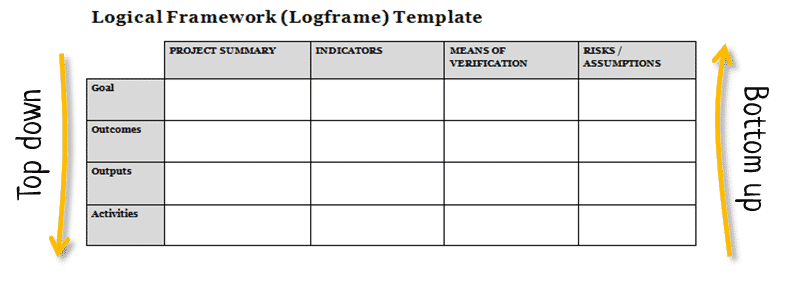
Some people would say to start from the top (goal) and work down. That way you state what you hope to achieve, and then you work backwards to decide which outcomes, outputs and activities are required to achieve it.
However, this is often difficult to do in practice. Many organisations have a fixed set of activities that requires them to go from the bottom up. Other organisations may go back and forth between the goal and the activities trying to balance costs against results.
So just fill the table in whichever order makes the most sense to you. For each row of the table (activities, outputs, outcomes and goal) you will need to complete the following steps.
Describe the project summary
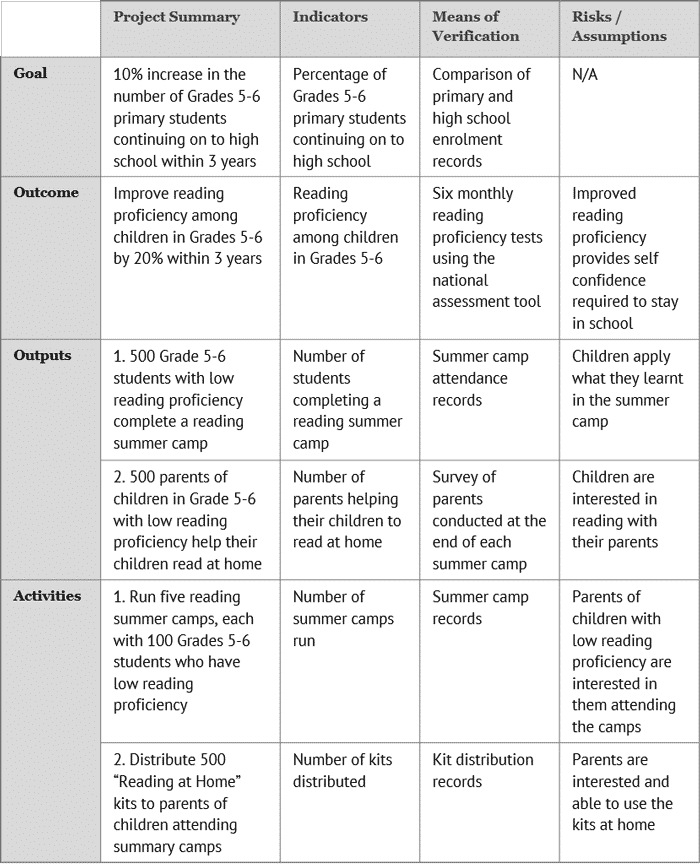
The first column in the table is the project summary. It describes each level of your project. For example, the goal of the project could be a “10% increase in the number of Grades 5-6 primary students continuing on to high school within 3 years.” The outcome leading to this could be “improve reading proficiency among children in Grades 5-6 by 20% within 3 years.”
When completing the project summary it is very important that the links between the different levels of the project are realistic and logical. Activities should logically lead to outputs, which should lead to realistic outcomes, and a sensible goal.
Below is an example of a logframe where the links between levels are not logical or realistic (click the image to view a larger version).

If you’re having difficulty creating logical and realistic connections between the different levels, you might want to try creating a problem tree or theory of change first.
Choose indicators and means of verification
Once you’ve described each level of the project you need to choose indicators that will allow you to measure if it has been achieved. For example, if the goal is a “10% increase in the number of Grades 5-6 primary students continuing on to high school within 3 years” then the indicator is “percentage of Grades 5-6 primary students continuing on to high school.”
You can have more than one indicator for each level, but it’s a good idea to keep the total number of indicators manageable. For each indicator you need to describe how it will be measured – this is called the means of verification.
Here’s a example of these two columns:
The indicators in your logframe should match the indicators in your M&E framework. For more information on selecting indicators see our article on how to write a monitoring and evaluation (M&E) framework.
Identify risks and assumptions
The final column in a logframe is the risks and assumptions. This column lists things that must be true in order for one level to lead to the next level.
An easy way to check whether your risks/assumptions make sense is to look at the activities row and follow this logic: IF these activities are undertaken AND the assumptions are true THEN these outputs will be produced (see example below, click the image to view a larger version):
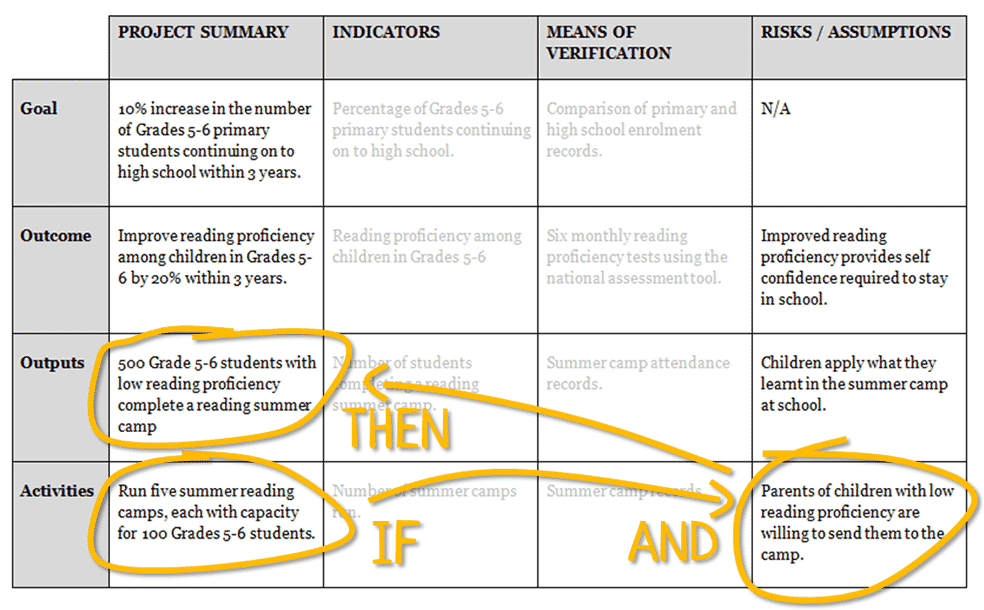
Then do the same with the outputs: IF the outputs are created AND the assumptions are true THEN the outcome will be achieved. And then the same for the outcome: IF the outcome is achieved AND the assumptions are true THEN the goal will be achieved.
Still not sure how to write a logical framework?
Complete our eLearning module
Teaching logical frameworks to others?
Download a lesson plan kit