Review Overview
Accuracy - 7
Ease of use - 9
Usefulness - 10
8.7
An easy to use tool that measures poverty with just 10 questions. Already customised and translated for many different countries.
The $1.25 per day international poverty line is the most commonly used measure of poverty. International agencies use it, donors use it, and many NGOs and microfinance institutions want to make sure their programs are reaching people below this line.
Unfortunately, determining whether a family actually lives on less than $1.25 per person per day can be extremely challenging – it’s not as simple as asking how much they earn. To start with the $1.25 per day line isn’t even measured in dollars, pesos or rupees. It’s measured in mysterious economic units called “Purchasing Power Parity” (PPP) which takes into account currency differences and exchange rates. Add to this the fact that many families grow crops or raise animals which they eat (or barter with), and have several informal loans going simultaneously, and you start to wonder whether it’s even possible to know if a family lives below the magic $1.25 PPP.
The Progress out of Poverty Index® – or PPI® for short – was created by the Grameen Foundation to address exactly this problem. It uses 10 simple questions, such as “What material is your roof made out of?” or “How many of your children are in school?” to determine the likelihood that a particular household is living below the poverty line. The best part is that the tool has already been customised for 45 countries and can be downloaded for free on their website www.progressoutofpoverty.org (you must register first). Translations of the tool into local languages are also available from the website, although it took a while to find them at the very bottom of the download page.
How does it work?
The Grameen Foundation created each of the country PPI® tools by looking at hundreds of questions in national household surveys to see which ones were most strongly related to poverty. The top 10 most powerful questions were selected through a combination of statistical analysis and expert judgement, and these became the PPI® tool. Each country has a different set of 10 questions These are the ones for Cambodia:
- How many members does the household have?
- How many children ages 7 to 15 attend school?
- What is the primary construction material of the outer wall of the dwelling unit occupied by the household?
- What type of fuel does the household mainly use for cooking?
- What toilet facility does the household have?
- How many bicycles and motorcycles does the household own?
- Does the household own a bed set?
- Does the household own a wardrobe or cabinet?
- Does the household own a water pump?
- Does the household own a television?
The answers for each question are multiple choice, and each answer is assigned a score. Below you can see an example of the answers and scoring for one of the Cambodian questions:
Q6. How many bicycles and motorcycles does the household own?
-
- A. No bicycles, and no motorcycles = 0 points
- B. One bicycle, and no motorcycles = 4 points
- C. Two bicycles, and no motorcycles = 4 points
- D. Three or more bicycles, and no motorcycles = 11 points
- E. One or more motorcycles (regardless of bicycles) = 13 points
Once the survey is complete you just add up the total score for all 10 questions. The total score can range from 0 (extremely poor) to 100 (not poor). Now that you have the total score for the household, you then use a table to lookup the probability that the household is below a particular poverty line. For example if a Cambodian household had a score of 27, then based on the lookup table their probability of being below the $1.25 per day international poverty line is 39.8%.

Source: Cambodia PPI® indicators and lookup table
One of the great things about the PPI® tool is that it includes tables for lots of different poverty lines, including the $1.25 per day international poverty line, the national poverty line for the country in question, the food poverty line, and the USAID “extreme” poverty line. One of the more confusing things about PPI® is that households are given a percentage likelihood of being below the poverty line, rather than simply saying they are definitely “below” it. This may not be intuitive for some people, and has the potential to cause confusion – when I used this tool in practice I had a lot of difficulty explaining to people what a “39.8% chance of being below the poverty line” actually meant.
However, once you have calculated the likelihood that each household is below the poverty line, you can then average these results to estimate the total percentage of households that are below the poverty line (which is very clear and unambiguous). Below is an example with data from 10 households, which shows that approximately 25% of all the households in the sample are living below $1.25 per day.

What is it like to use in practice?
For one of the programs I worked on in Cambodia we used the PPI® tool to measure the poverty of 1300 HIV positive women at the start of the program (baseline) and end of the program (endline). We only had a small budget, so we used our own field staff to collect the data rather than professional data collectors.
Most of our field staff had completed at least 9 years of school and could read and write. After a short training session they found the tool very easy to use, although a few of the questions caused confusion. For example, the question “How many children ages 7 to 15 -attend school?” did not have a “not applicable” option for families without children aged 7-15 years. Some staff were also confused by the question “Does the household own a bed set?”, since they were not sure whether a bamboo platform counted as a “bed” or whether it had to be made out of wood, and if so, did it need to be raised off the ground? To address this we made a few minor adjustments to some of the question answers, and created our own guide for training the staff.
Once all the staff were trained and data collection started, each survey took less than 15 minutes to complete. The data collectors visited every house in order to confirm answers to questions such as “Does the household own a television?” through observation. However, home visits are not always possible, and so we also tried it without home visits and received relatively accurate answers based on what we knew about their home situation.
We found entering the data very quick and easy since there were only 10 questions, all with numerical scores. The tool came with a clear instruction guide, check-lists, and even a ready made Excel spreadsheet for entering the data! Although the basic instruction guide was easy to follow, it did not clearly explain how to calculate the total percentage of households below the poverty line by averaging the likelihoods for all households. I had to look in the advanced guide for that information, which was a bit intimidating since it includes all the gory details of the statistical methods they used to make the tool.
What do the results look like and how can they be used?
After entering all the data we were left with a list of the households, their corresponding PPI® score and the likelihood they were below the poverty line (similar to the table above). Individual household scores like this have a variety of uses. One of the main uses is to determine which households should be selected for a program. For example, you might only select households with a score of less than 25, because they are most likely to be below the poverty line. Of course, not every tool is perfect, so there will always be some false positives (people being included who are not actually below the poverty line) and false negatives (people being excluded who are really below the poverty line). You can also use individual household scores at the start and end of the program to see how a family’s situation has changed over time.
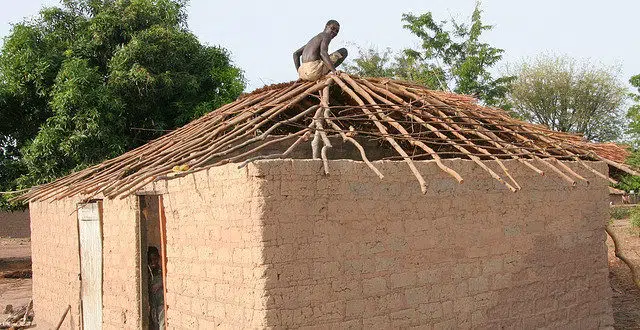
The PPI® tool really comes into its element when looking at results for groups of households. For example, if you collect PPI® scores from a representative sample of households you can then make a chart like the one below, which shows how the households are distributed on the PPI® scale from 0 to 100.
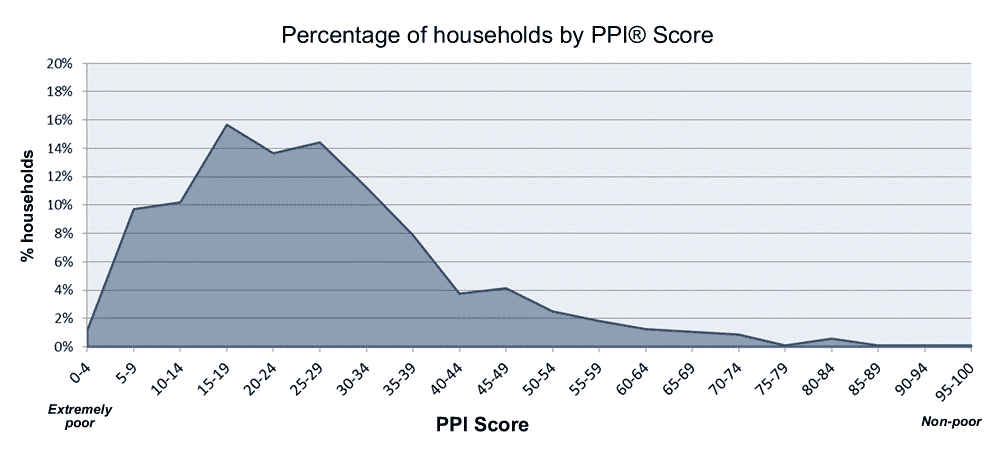
If you do this at the start and end of your program, or periodically during the program, you can see how the participants become wealthier or poorer over time (see chart below).
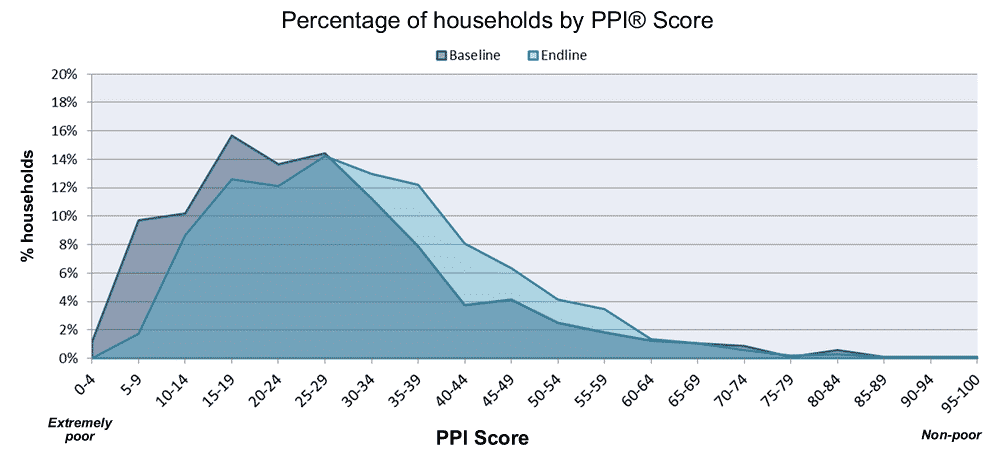
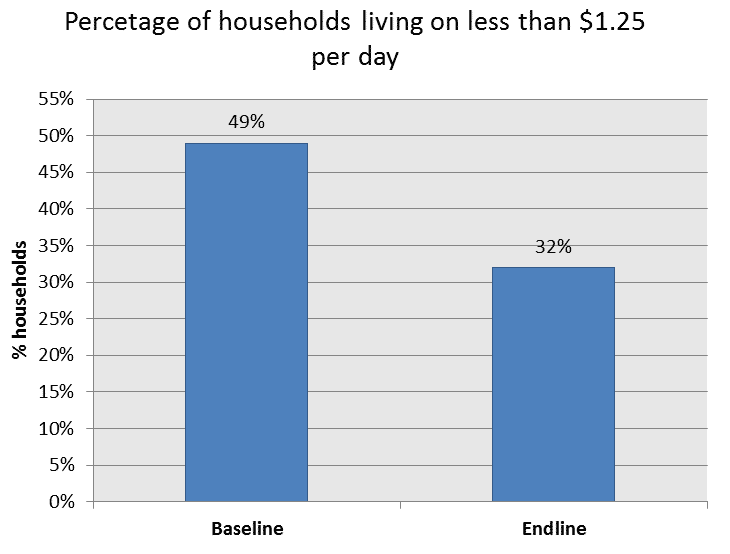
Another way of showing changes in poverty over time is to calculate the percentage of households below the poverty line at the start and end of the program and show it in a bar chart. The example below shows that at the start of the program 49% of households lived on less than $1.25 per day, and by the end of the program this had dropped to 32%.
What are the limitations?
One of the great benefits of the PPI® is that it is based on nationally representative surveys, and so it is perfect for use with the general population. This can also be a downside if you are using it with a very specific group who may experience poverty differently. For example, our staff raised the concern that widows who were only recently diagnosed with HIV may still have all their household belongings (and so score highly on the PPI®) but may be too sick to work, and so they might actually be living below the poverty line. Situations like this may require some modifications to the tool, although in our case most of the women had been diagnosed 5-10 years previously, and so this was not a major concern.
Another problem with the PPI® is that it is only a very rough measure of poverty, and so it was not able to easily measure the very small changes in household situation as a result of our program. It is also limited to a scale of 0 to 100, so we found that although some families in extreme poverty had their situation become worse between the start and end of the program, this was not picked up by the instrument because they were already at the very bottom of the scale. Similarly, some of the wealthy families in the program became richer during the program, but because they were already near the top of the scale this was not picked up.
The bottom line
The Progress out of Poverty Index® is an fantastic creation by the Grameen Foundation. Although there are many other tools available to measure poverty, the PPI® tool is particularly easy to use, well documented, and is already customised and translated for a wide range of countries.
The PPI® tool is a good choice when:
- You need to know how many of your program participants are below the poverty line.
- You want to select program participants based on whether or not they are below the poverty line.
- You need to measure changes in poverty over time.
- You want to tailor parts of the program or service to an individual’s poverty level.
- You are using field staff to collect the data rather than professional data collectors.
- You have a limited amount of time to collect the data.
- You have limited statistical skills.
The PPI® tool is NOT a good choice when:
- You want to measure very small changes in poverty or living conditions for individual households.
- You are conducting quantitative research and want to use the results in complex bivariate or multivariate statistical analysis (the limited scale makes this difficult).
- There is another official tool that you should be using based on national or donor requirements.
- Your data collection staff have low literacy.
Photo by hdptcar