Review Overview
Accuracy - 6
Ease of use - 7
Usefulness - 8
7
A collection of quick and easy tools to help community members express how their lives have changed.
Many international development / aid programs try to directly improve people’s lives through activities such as building boreholes, running agricultural training programs, or setting up youth programs.
When evaluating these types of programs it can be difficult to know if community members really believe that their situation has improved. Sometimes people find it difficult to express themselves, or they only say what they think wants to be heard.
To address these challenges NGO-IDEAs have put together a collection of quick and easy activities (“Tiny Tools”) that you can run with community members to help them assess the impact of a program. An overview of all the tools is available in English, French and Spanish.
How does it work?
Each of the Tiny Tools is designed to be used by a facilitator with a group of community members during a short workshop or focus group. The purpose of the tools is to help the community members assess the impact that the project has had on their lives.
Here are some examples of the Tiny Tools available:
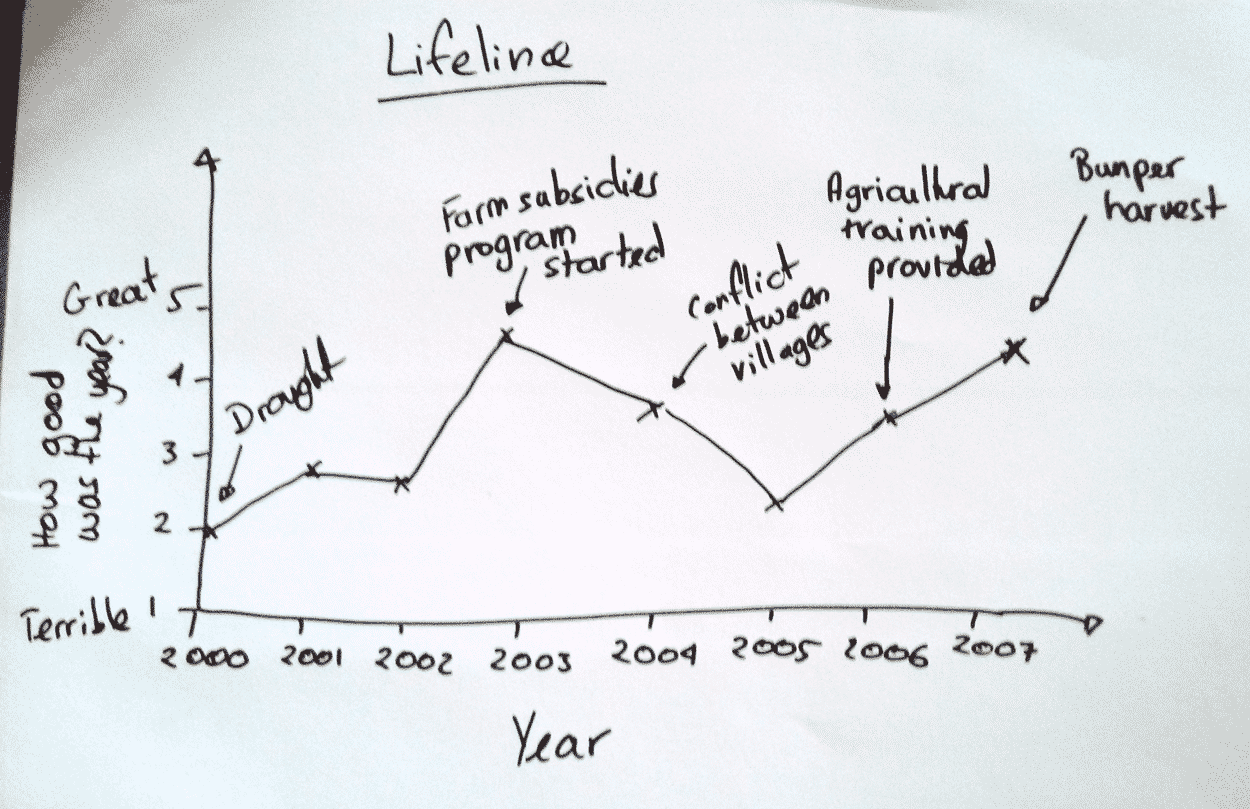
- Lifeline / Quality of Life Curve: Community members rate each year that they can remember on a scale from 1 (lowest rating) to 5 (highest rating) on a chart. They then mark the significant events that caused them to give the ratings (e.g. drought, building of a borehole, disease outbreak, introduction of farm subsidies, etc.)
- Road Journey Diagram: Community members draw a picture of a road that describes changes in their community over time. For example, the road may show pictures of a new school being built, or people fighting within the village. The road can be extended into the future to show where the community wants to go.
- Activity List: Community members list all the activities being run by different organisations in their area. They then rate activities based on their importance, who benefited, and how much time and effort they put into the activities.
- Influence Matrix: Community members list the areas of their lives that have changed (e.g. income, skills, food security, etc) down one side of the table. On the other side of the table they list the activities of the program. They then rate on a scale from 0 to 10 how much each activity has influenced each part of their lives.
What is it like to use in practice?
Although I haven’t been able to try all the Tiny Tools, I have seen several of them used with community groups in Cambodia and Malawi. My experience is that the most simple visual tools, such as the Lifeline and Road Journey diagram, were easily understood by community members. They were quick to implement – taking only a couple of hours – and the results could be understood by others.
However, I have found that more analytical tools, such as the Activity List and Influence Matrix, can be a bit confusing for some participants. This is particularly true when many of the community members have low literacy and so are not able to read the tables that have been created. In these situations the facilitator can end up dominating the discussion by accident in an attempt to get things finished (exactly the opposite of what Tiny Tools are meant to do!).
What do the results look like and how can they be used?
The output of all the Tiny Tools is a visual representation of how people’s lives have changed. An example of a Lifeline is shown below:
Here is an example of an Activity List:
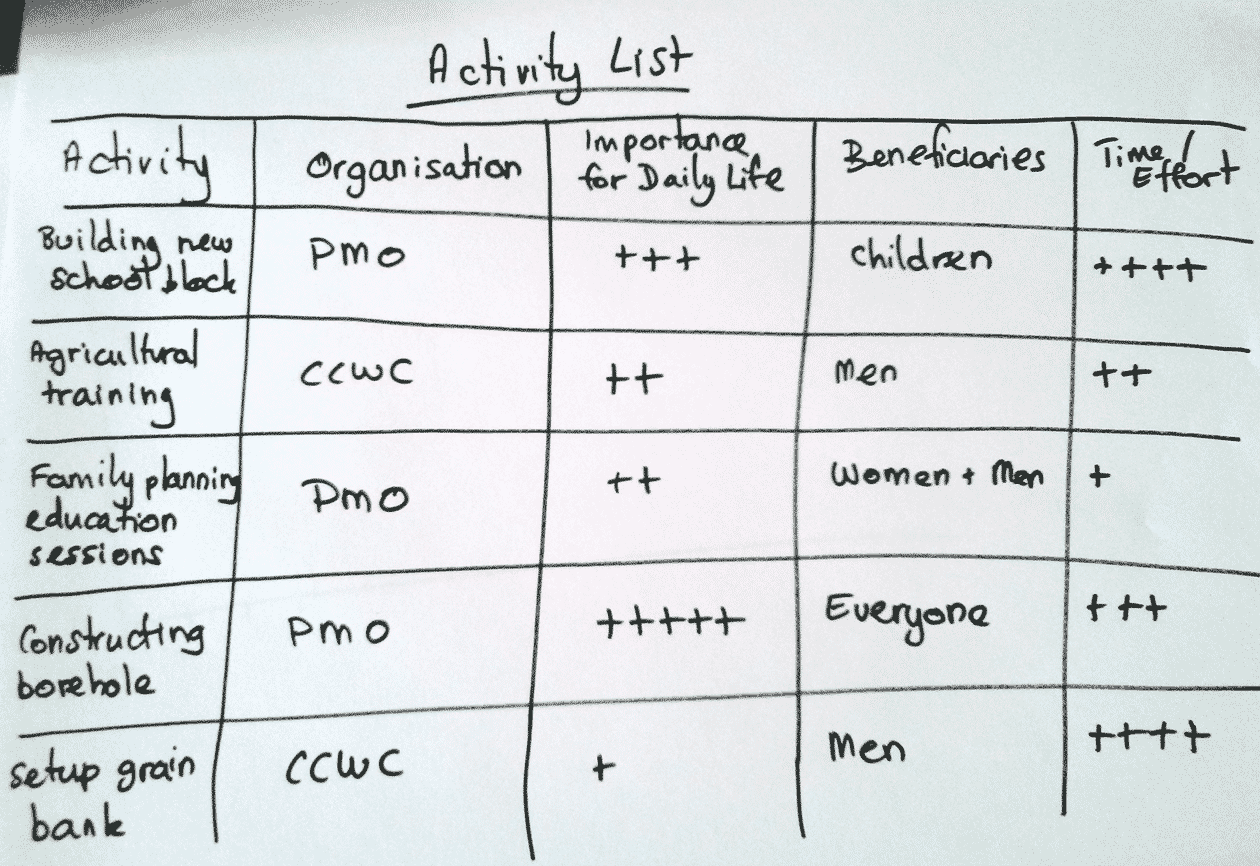
These visual outputs can be used in reports, along with a narrative description, to show how communities believe that the program has impacted their lives. They can also be placed in a public area for the community to track their own achievements, or as the basis for further discussions and strategic planning.
While many of the Tiny Tools generate qualitative data, some can also provide quantitative data (also called “participatory statistics”). One of the developers of Tiny Tools provided me with two examples of this – a study of rural development using Trend Analysis and a study on cotton farming published in the book Who Counts?
What are the limitations?
The people at NGO-IDEAs believe that “Communities know a lot about the impact of development projects. They know much about how they made use of the projects, what changed and why it changed.” While this is certainly true in many cases, it is not always the case.
For example, public health programs often prevent diseases in the future and so community members may not realise what has changed, or why. Similarly, high level policy / advocacy programs may not directly involve community members in activities. In these cases it may be necessary to combine the results of community feedback with objective quantitative studies to confirm if people’s lives were actually improved.
It’s also important to understand the impact that the facilitator can have on the accuracy of the results. A good facilitator will encourage participants to give honest feedback. A bad facilitator will bias the discussion, leading to results that don’t represent the community’s real feedback.
The bottom line
Tiny Tools is a collection of quick and easy activities that can be used to elicit feedback from community members on how the project has impacted their lives.
Tiny Tools are a good choice when:
- Your project aims to improve the lives of community members through directly involving them in activities.
- You want community members to actively participate in the evaluation process.
- You want feedback from community members on their subjective experiences of the program.
- You have a good facilitator, but limited time or budget.
Tiny Tools are NOT a good choice when:
- Your project works indirectly to improve the lives of community members, such as through high level policy work or other activities that don’t directly involve community members.
- You want completely objective information on the program’s impact.
- You don’t have a good facilitator.
Photo by Marie Sahlén


